
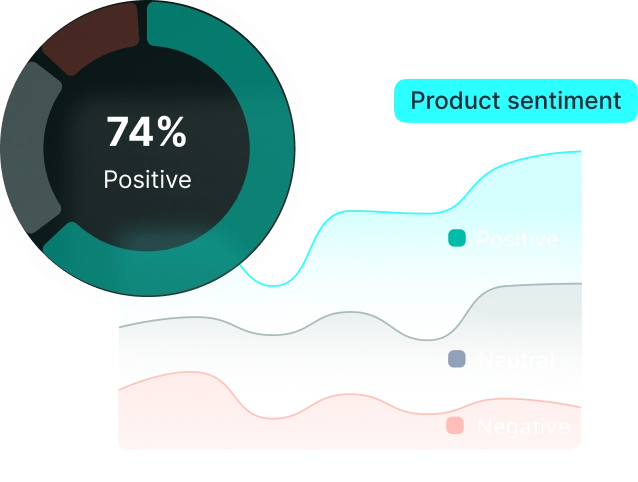
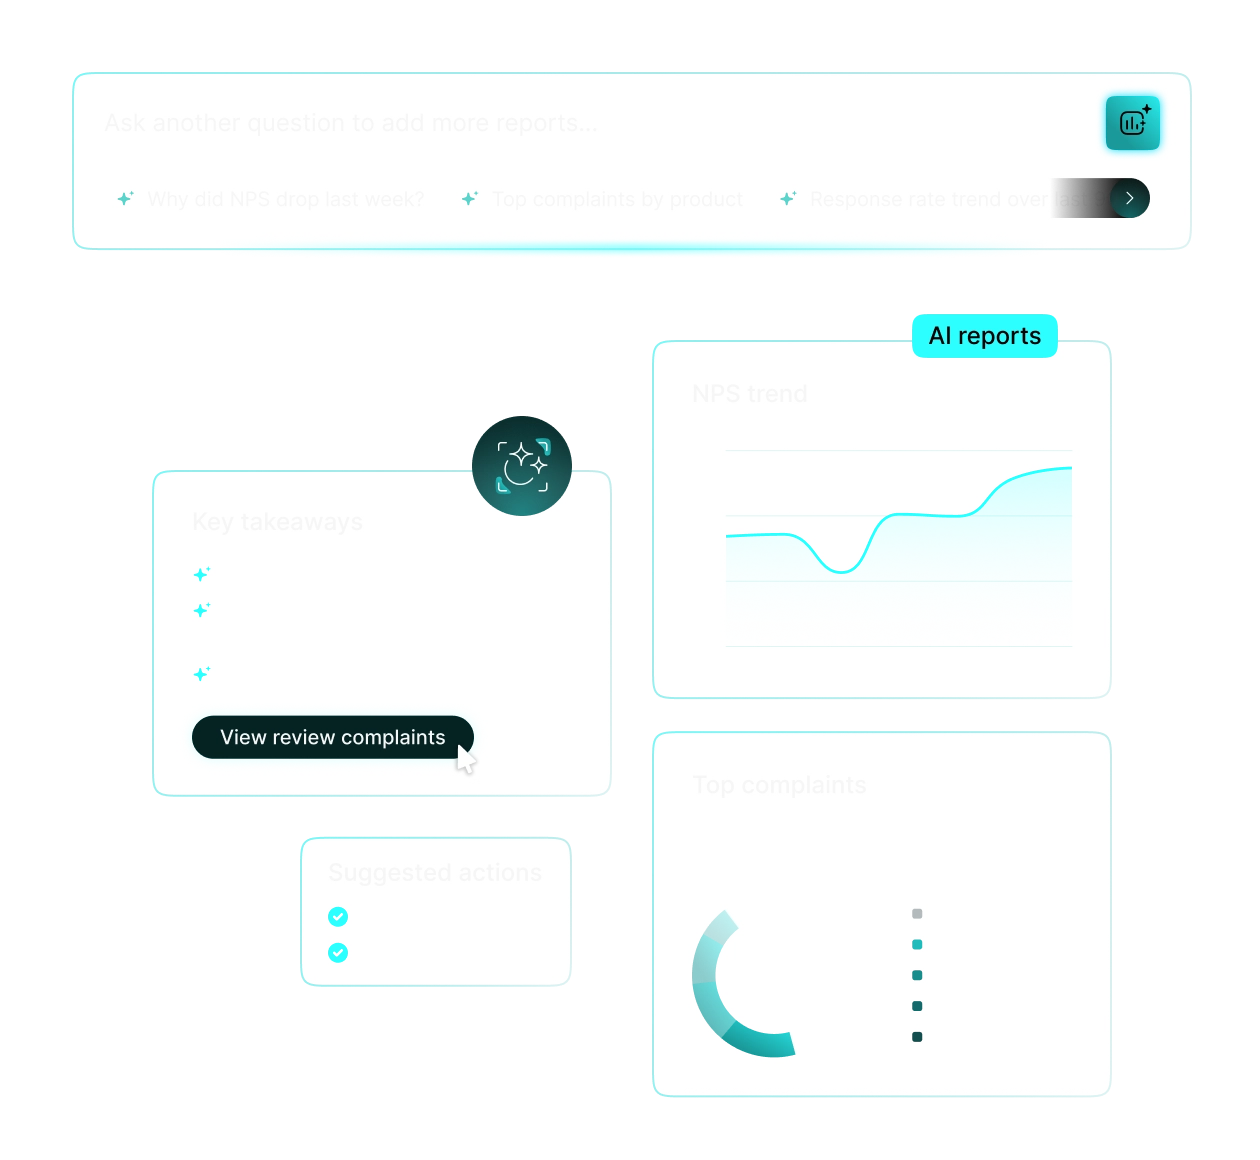

The Insights & Analytics page gives you a consolidated view of your review program performance. Key metrics include your overall star rating, total reviews collected, Net Promoter Score (NPS), best and worst scoring products, invite conversion rates, and sentiment trends over time.
All metrics update when you apply the date filter at the top of the page, so you can compare any custom time window.
Use the date picker at the top of the Insights & Analytics page. Enter a start and end date; the entire dashboard will refresh to show only data within that window. If no dates are set, the page defaults to showing all historical reviews in your account.
To export data for a specific period (for example, last week's NPS figures), head to Reporting → Export Statistics and apply the same date range there.
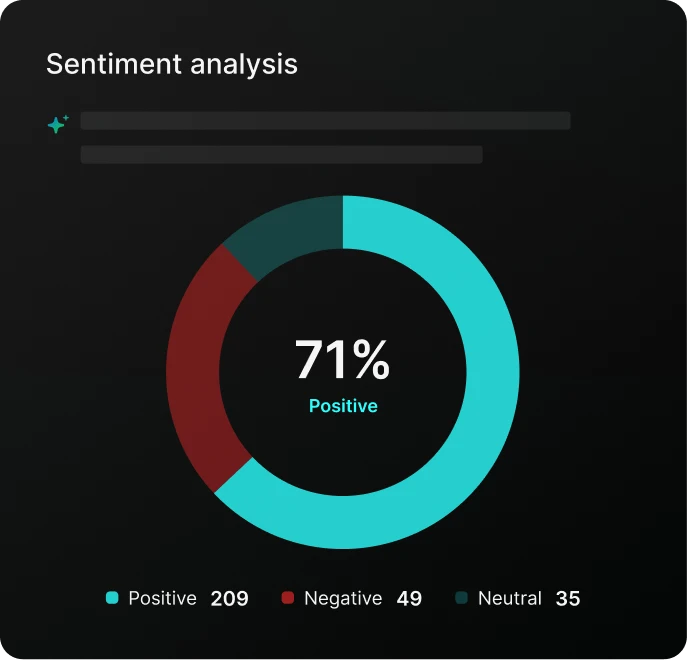
REVIEWS.io supports two NPS calculation modes. When the dedicated NPS survey question is enabled on your collector page (available on the Plus plan), the score is calculated using the standard Promoter minus Detractor formula. This is the most accurate measure of customer loyalty.
When the NPS question is not active, the platform generates an estimated score from star ratings using the formula: (100 ÷ total reviews) × (4 and 5 star reviews). If most of your reviews are 4 or 5 stars, this estimated figure can appear as 100, it does not mean the data is broken, it reflects a different calculation method.
To see a true NPS, enable the NPS collector question from Settings → Collector Page.
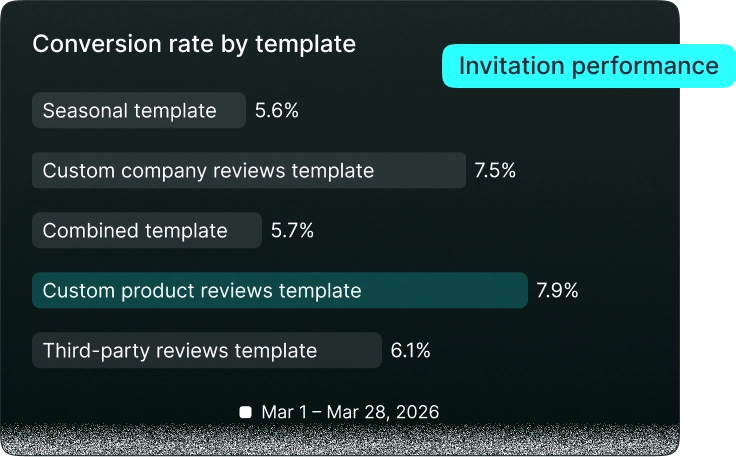
Yes. The Insights & Analytics dashboard shows invite volume alongside how many reviews were actually submitted, giving you an end-to-end conversion rate. You can filter by date to assess the impact of any changes you make to your email templates or sending cadence.
If you send invites via Klaviyo, be aware that REVIEWS.io only receives data once a recipient clicks the review link. Open and click stats from the email itself remain inside Klaviyo.
For a full-funnel view, cross-reference both platforms or consider sending directly through REVIEWS.io to keep all reporting in one place.
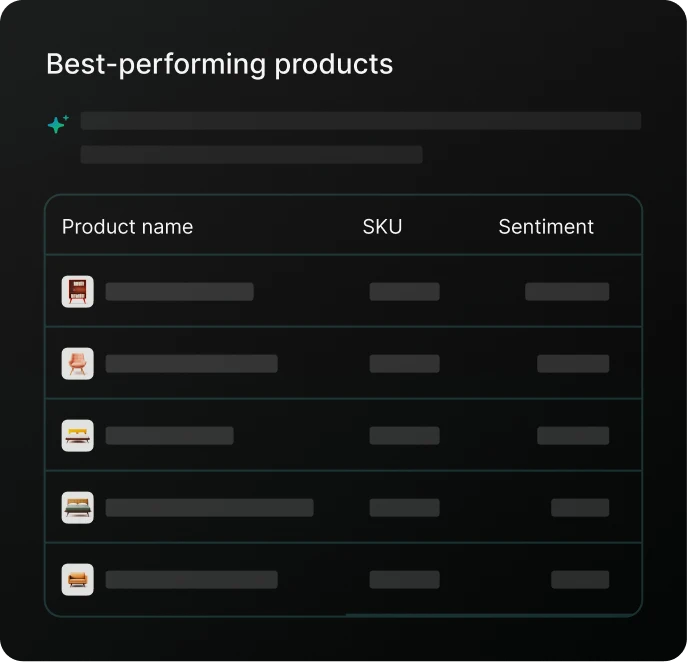
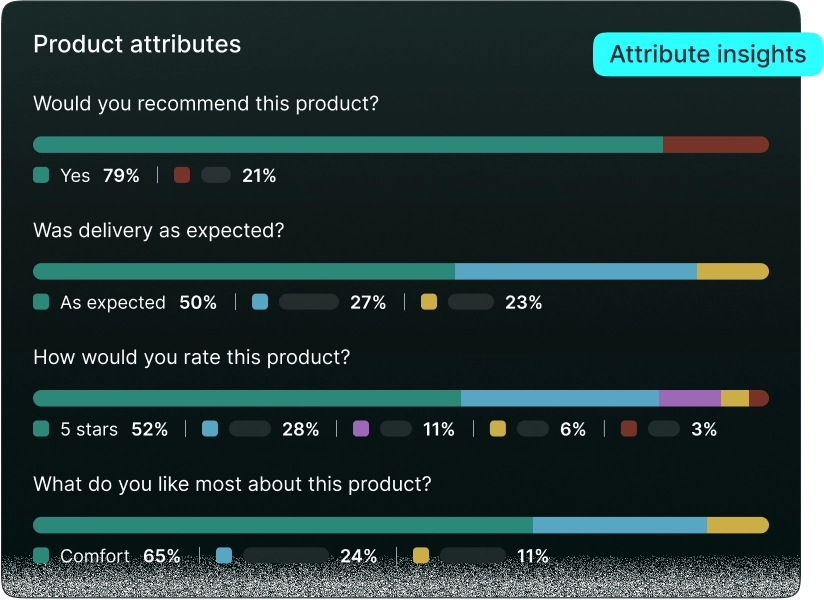
Yes. The product-level view inside Insights & Analytics ranks your products by average star rating, showing your top performers and those with the lowest scores. You can also see the total number of reviews per product and filter by date to track changes over time. For example, after a product update or a new collection launch.
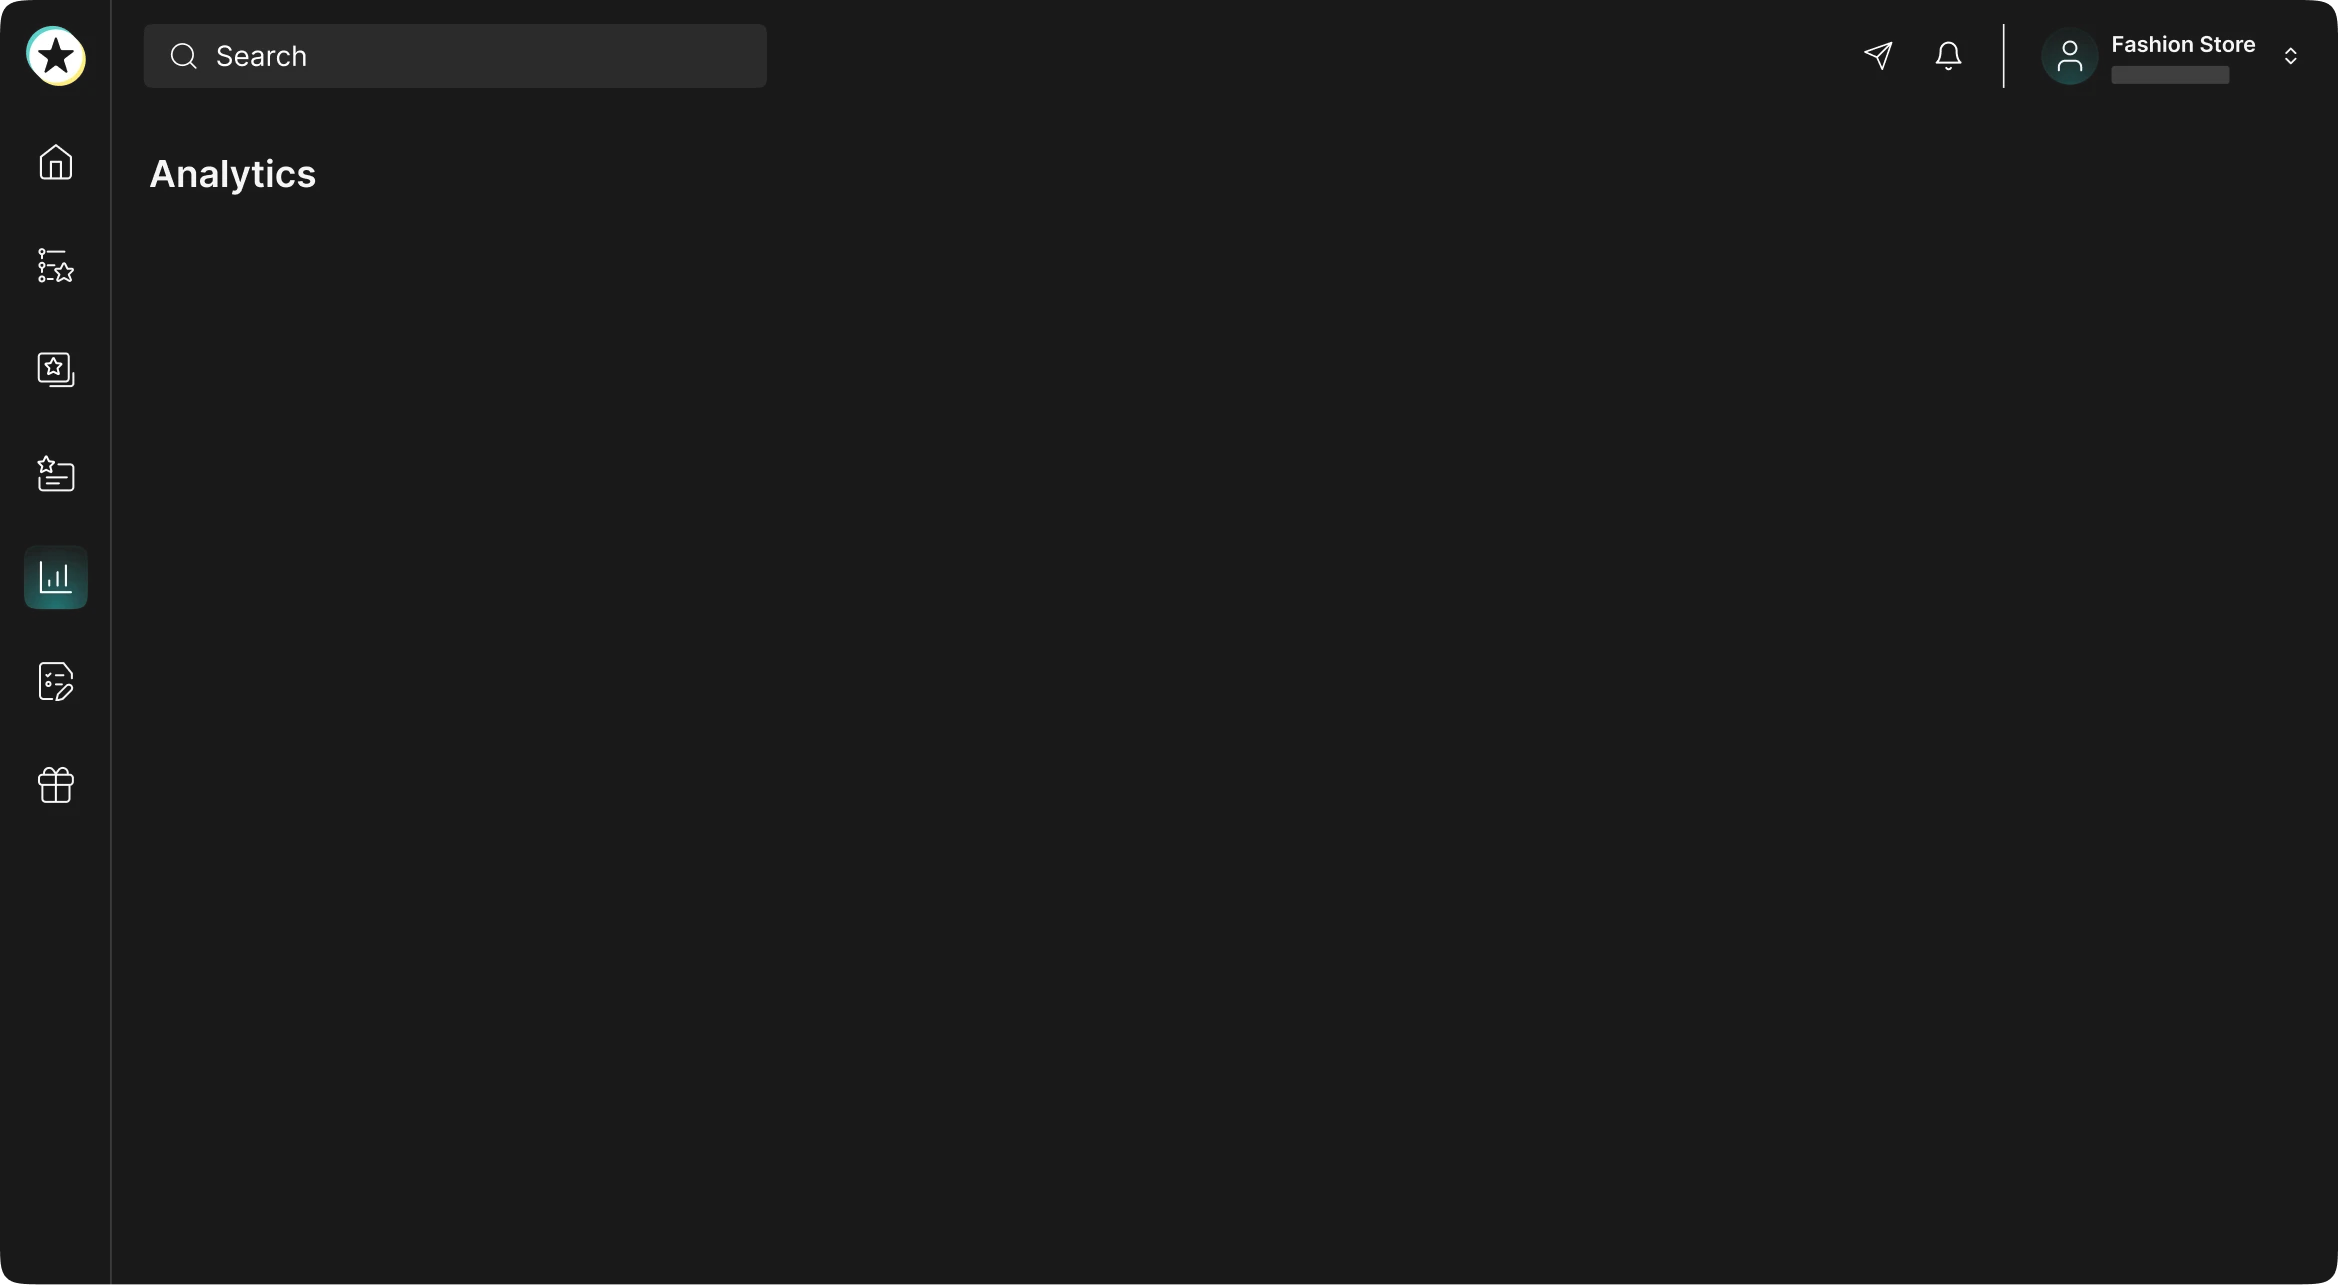
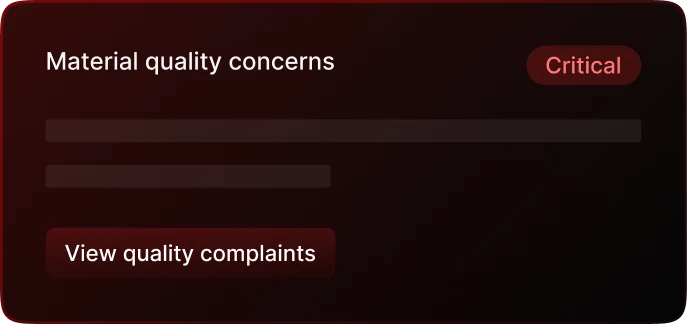
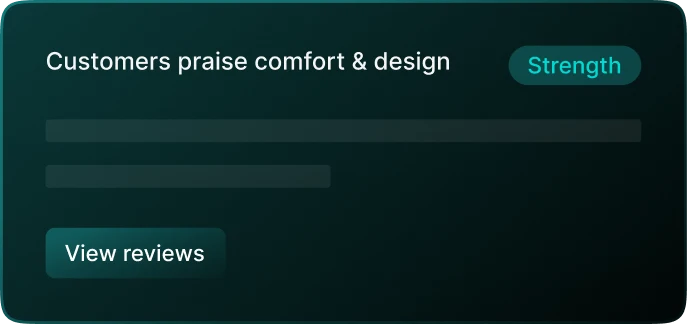
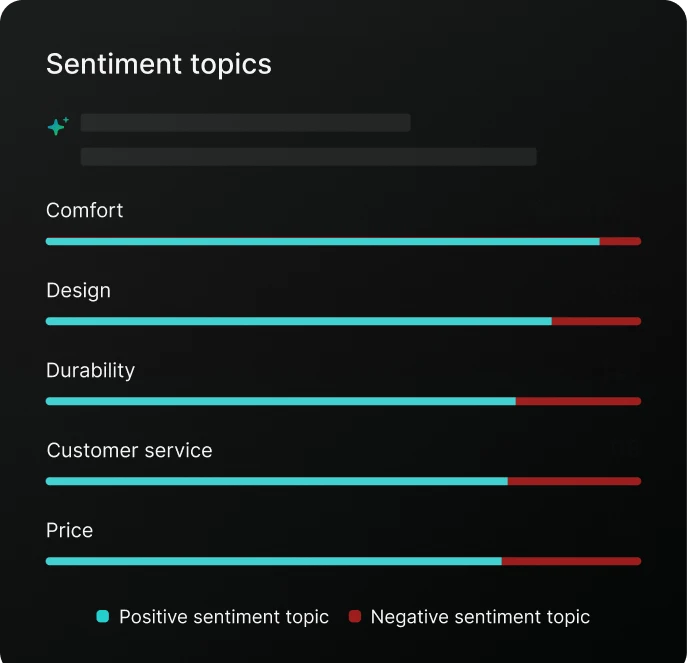
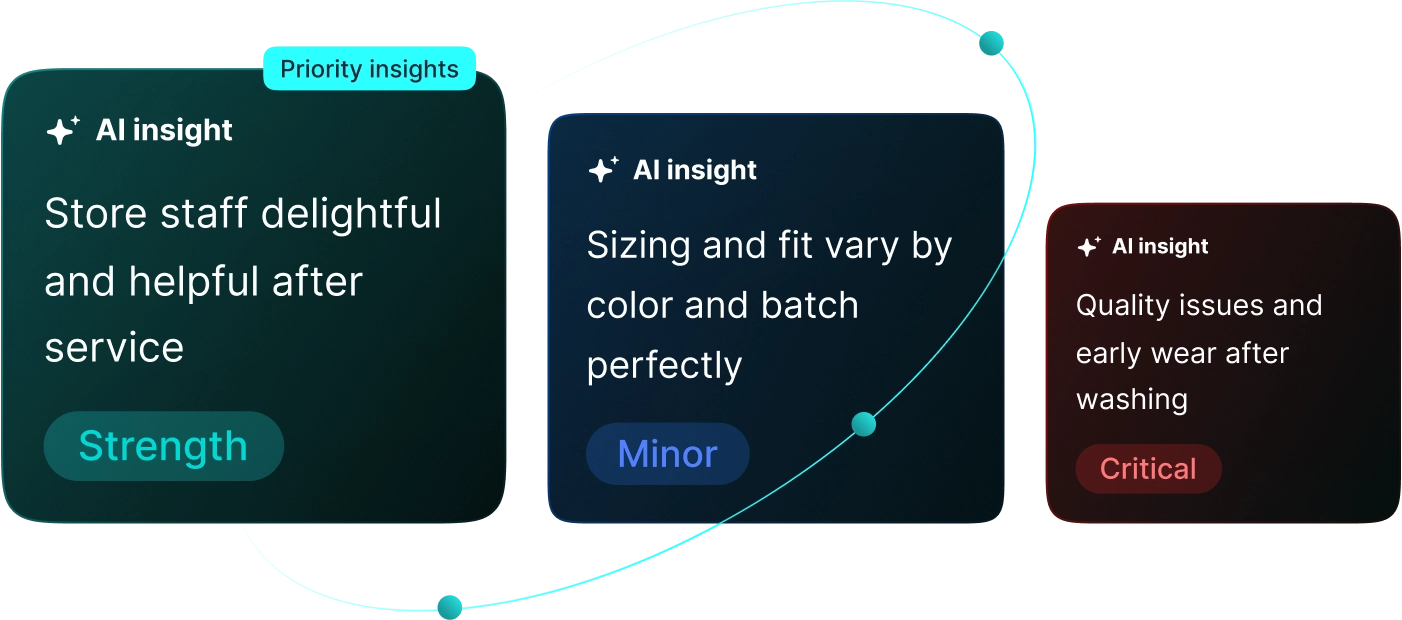
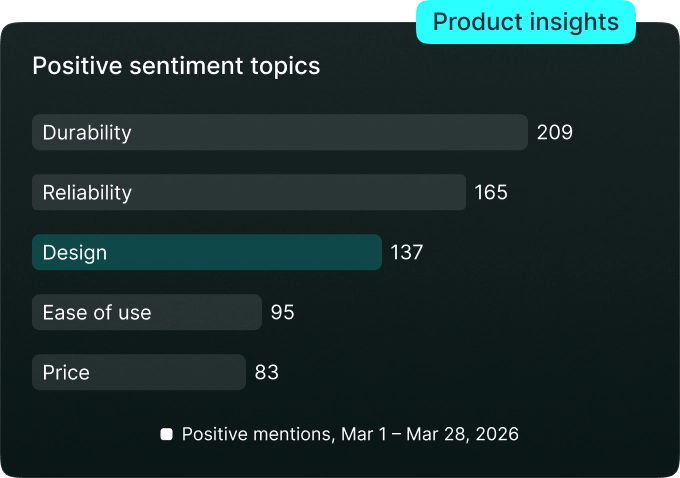
For deeper product-level sentiment (what customers say in the review text, not just the rating), the AI-powered analysis feature can surface the most common positive and negative themes mentioned across your product reviews.
REVIEWS.io sends a regular performance summary email that gives you a snapshot of key metrics including reviews collected, average rating, and invite performance. All without requiring you to log into the dashboard each time.
For more customised or scheduled reporting (for example, a weekly export of specific metrics delivered to your inbox), the recommended approach is to use the API to pull data on a schedule into your own BI or reporting tool.